O POWER BI É PARA VOCÊ
Ter visão 360º de sua empresa já é possível com
o Microsoft Power BI.

Data Science with Python explained
An overview of using Python for data science including Numpy, Scipy, pandas, Scikit-Learn, XGBoost, TensorFlow and Keras.
So you’ve heard of data science and you’ve heard of Python.
You want to explore both but have no idea where to start — data science is pretty complicated, after all.
Don’t worry — Python is one of the easiest programming languages to learn. And thanks to the hard work of thousands of open source contributors, you can do data science, too.
If you look at the contents of this article, you may think there’s a lot to master, but this article has been designed to gently increase the difficulty as we go along.
One article obviously can’t teach you everything you need to know about data science with python, but once you’ve followed along you’ll know exactly where to look to take the next steps in your data science journey.
Table contents:
- Why Python?
- Installing Python
- Using Python for Data Science
- Numeric computation in Python
- Statistical analysis in Python
- Data manipulation in Python
- Working with databases in Python
- Data engineering in Python
- Big data engineering in Python
- Further statistics in Python
- Machine learning in Python
- Deep learning in Python
- Data science APIs in Python
- Applications in Python
- Summary
Why Python?
Python, as a language, has a lot of features that make it an excellent choice for data science projects.
It’s easy to learn, simple to install (in fact, if you use a Mac you probably already have it installed), and it has a lot of extensions that make it great for doing data science.
Just because Python is easy to learn doesn’t mean its a toy programming language — huge companies like Google use Python for their data science projects, too. They even contribute packages back to the community, so you can use the same tools in your projects!
You can use Python to do way more than just data science — you can write helpful scripts, build APIs, build websites, and much much more. Learning it for data science means you can easily pick up all these other things as well.
Things to note
There are a few important things to note about Python.
Right now, there are two versions of Python that are in common use. They are versions 2 and 3.
Most tutorials, and the rest of this article, will assume that you’re using the latest version of Python 3. It’s just good to be aware that sometimes you can come across books or articles that use Python 2.
The difference between the versions isn’t huge, but sometimes copying and pasting version 2 code when you’re running version 3 won’t work — you’ll have to do some light editing.
The second important thing to note is that Python really cares about whitespace (that’s spaces and return characters). If you put whitespace in the wrong place, your programme will very likely throw an error.
There are tools out there to help you avoid doing this, but with practice you’ll get the hang of it.
If you’ve come from programming in other languages, Python might feel like a bit of a relief: there’s no need to manage memory and the community is very supportive.
If Python is your first programming language you’ve made an excellent choice. I really hope you enjoy your time using it to build awesome things.
Installing Python
The best way to install Python for data science is to use the Anaconda distribution (you’ll notice a fair amount of snake-related words in the community).
It has everything you need to get started using Python for data science including a lot of the packages that we’ll be covering in the article.
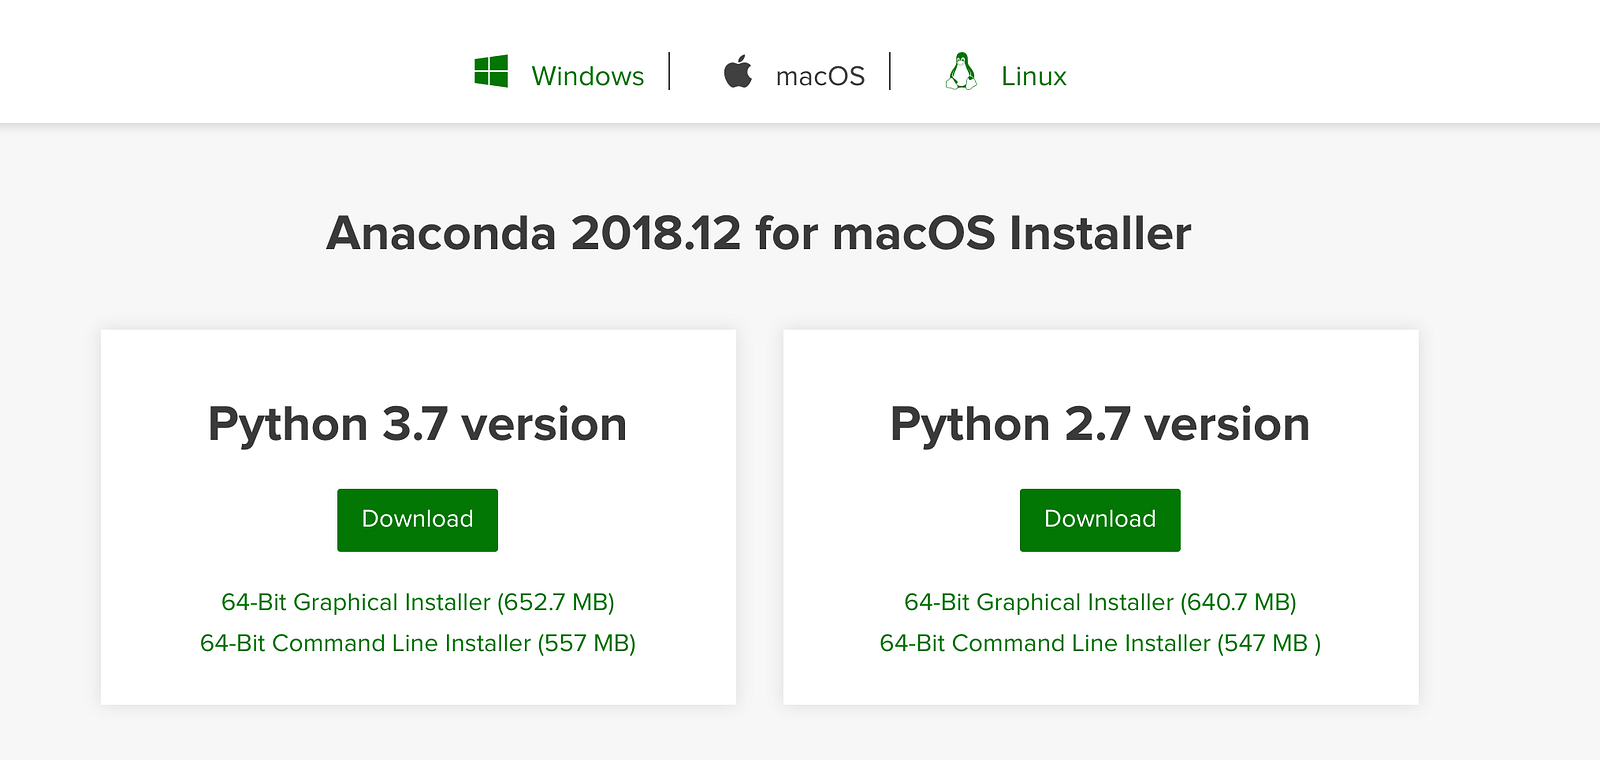
If you click on Products -> Distribution and scroll down, you’ll see installers available for Mac, Windows and Linux.
Even if you have Python available on your Mac already, you should consider installing the Anaconda distribution as it makes installing other packages easier.
If you prefer to do things yourself, you can go to the official Python website and download an installer there.
Package Managers
Packages are pieces of Python code that aren’t a part of the language but are really helpful for doing certain tasks. We’ll be talking a lot about packages throughout this article so it’s important that we’re set up to use them.
Because the packages are just pieces of Python code, we could copy and paste the code and put it somewhere the Python interpreter (the thing that runs your code) can find it.
But that’s a hassle — it means that you’ll have to copy and paste stuff every time you start a new project or if the package gets updated.
To sidestep all of that, we’ll instead use a package manager.
If you chose to use the Anaconda distribution, congratulations — you already have a package manager installed. If you didn’t, I’d recommend installing pip.
No matter which one you choose, you’ll be able to use commands at the terminal (or command prompt) to install and update packages easily.
Using Python for Data Science
Now that you’ve got Python installed, you’re ready to start doing data science.
But how do you start?
Because Python caters to so many different requirements (web developers, data analysts, data scientists) there are lots of different ways to work with the language.
Python is an interpreted language which means that you don’t have to compile your code into an executable file, you can just pass text documents containing code to the interpreter!
Let’s take a quick look at the different ways you can interact with the Python interpreter.
In the terminal
If you open up the terminal (or command prompt) and type the word ‘python’, you’ll start a shell session. You can type any valid Python commands in there and they’d work just like you’d expect.
This can be a good way to quickly debug something but working in a terminal is difficult over the course of even a small project.
Using a text editor
If you write a series of Python commands in a text file and save it with a .py extension, you can navigate to the file using the terminal and, by typing python YOUR_FILE_NAME.py, can run the programme.
This is essentially the same as typing the commands one-by-one into the terminal, it’s just much easier to fix mistakes and change what your program does.
In an IDE
An IDE is a professional-grade piece of software that helps you manage software projects.
One of the benefits of an IDE is that you can use debugging features which tell you where you’ve made a mistake before you try to run your programme.
Some IDEs come with project templates (for specific tasks) that you can use to set your project out according to best practices.
Jupyter Notebooks
None of these ways are the best for doing data science with python — that particular honour belongs to Jupyter notebooks.
Jupyter notebooks give you the capability to run your code one ‘block’ at a time, meaning that you can see the output before you decide what to do next — that’s really crucial in data science projects where we often need to see charts before taking the next step.
If you’re using Anaconda, you’ll already have Jupyter lab installed. To start it you’ll just need to type ‘jupyter lab’ into the terminal.
If you’re using pip, you’ll have to install Jupyter lab with the command ‘python pip install jupyter’.
Numeric Computation in Python
It probably won’t surprise you to learn that data science is mostly about numbers.
The NumPy package includes lots of helpful functions for performing the kind of mathematical operations you’ll need to do data science work.
It comes installed as part of the Anaconda distribution, and installing it with pip is just as easy as installing Jupyter notebooks (‘pip install numpy’).
The most common mathematical operations we’ll need to do in data science are things like matrix multiplication, computing the dot product of vectors, changing the data types of arrays and creating the arrays in the first place!
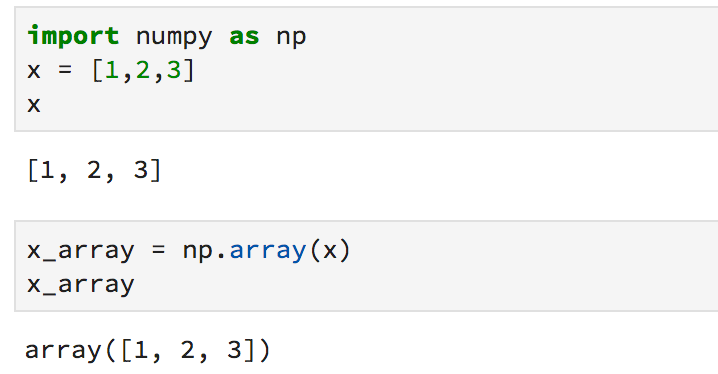
Here’s how you can make a list into a NumPy array:
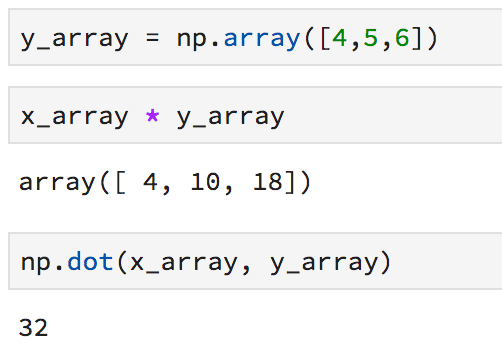
Here’s how you can do array multiplication and calculate dot products in NumPy:
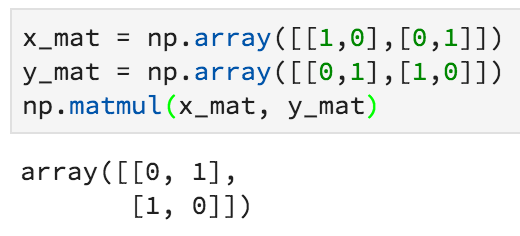
And here’s how you can do matrix multiplication in NumPy:
Statistics in Python
With mathematics out of the way, we must move forward to statistics.
The Scipy package contains a module (a subsection of a package’s code) specifically for statistics.
You can import it (make its functions available in your programme) into your notebook using the command ‘from scipy import stats’.
This package contains everything you’ll need to calculate statistical measurements on your data, perform statistical tests, calculate correlations, summarise your data and investigate various probability distributions.
Here’s how to quickly access summary statistics (minimum, maximum, mean, variance, skew, and kurtosis) of an array using Scipy:
Data Manipulation with Python
Data scientists have to spend an unfortunate amount of time cleaning and wrangling data. Luckily, the Pandas package helps us do this with code rather than by hand.
The most common tasks that I use Pandas for are reading data from CSV files and databases.
It also has a powerful syntax for combining different datasets together (datasets are called DataFrames in Pandas) and performing data manipulation.
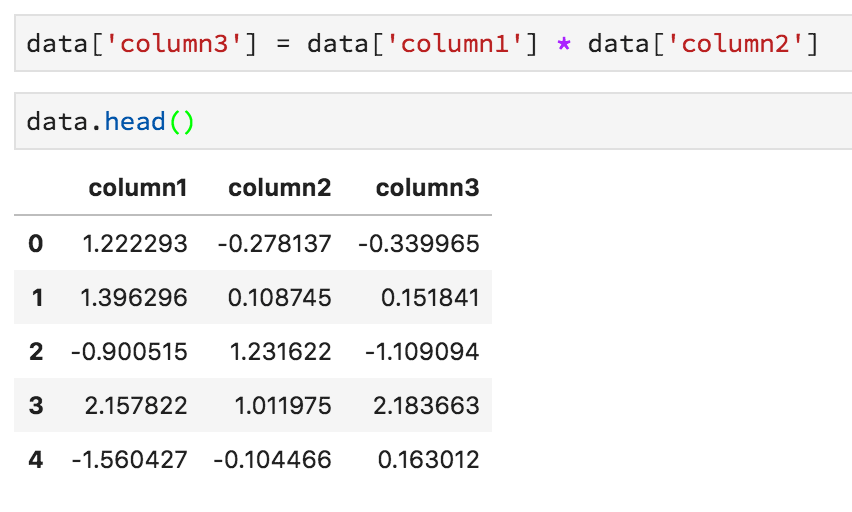
You can see the first few rows of a DataFrame using the .head method:
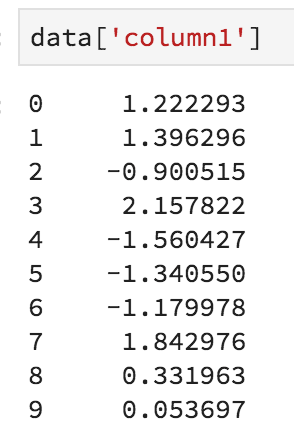
You can select just one column using square brackets:
And you can create new columns by combining others:
Working with Databases in Python
In order to use the pandas read_sql method, you’ll have to establish a connection to a database.
The most bulletproof method of connecting to a database is by using the SQLAlchemy package for Python.
Because SQL is a language of its own and connecting to a database depends on which database you’re using, I’ll leave you to read the documentation if you’re interested in learning more.
Data Engineering in Python
Sometimes we’d prefer to do some calculations on our data before they arrive in our projects as a Pandas DataFrame.
If you’re working with databases or scraping data from the web (and storing it somewhere), this process of moving data and transforming it is called ETL (Extract, transform, load).
You extract the data from one place, do some transformations to it (summarise the data by adding it up, finding the mean, changing data types, and so on) and then load it to a place where you can access it.
There’s a really cool tool called Airflow which is very good at helping you manage ETL workflows. Even better, it’s written in Python.
It was developed by Airbnb when they had to move incredible amounts of data around, you can find out more about it here.
Big Data Engineering in Python
Sometimes ETL processes can be really slow. If you have billions of rows of data (or if they’re a strange data type like text), you can recruit lots of different computers to work on the transformation separately and pull everything back together at the last second.
This architecture pattern is called MapReduce and it was made popular by Hadoop.
Nowadays, lots of people use Spark to do this kind of data transformation / retrieval work and there’s a Python interface to Spark called (surprise, surprise) PySpark.
Both the MapReduce architecture and Spark are very complex tools, so I’m not going to go into detail here. Just know that they exist and that if you find yourself dealing with a very slow ETL process, PySpark might help. Here’s a link to the official site.
Further Statistics in Python
We already know that we can run statistical tests, calculate descriptive statistics, p-values, and things like skew and kurtosis using the stats module from Scipy, but what else can Python do with statistics?
One particular package that I think you should know about is the lifelines package.
Using the lifelines package, you can calculate a variety of functions from a subfield of statistics called survival analysis.
Survival analysis has a lot of applications. I’ve used it to predict churn (when a customer will cancel a subscription) and when a retail store might be burglarised.
These are totally different to the applications the creators of the package imagined it would be used for (survival analysis is traditionally a medical statistics tool). But that just shows how many different ways there are to frame data science problems!
The documentation for the package is really good, check it out here.
Machine Learning in Python
Now this is a major topic — machine learning is taking the world by storm and is a crucial part of a data scientist’s work.
Simply put, machine learning is a set of techniques that allows a computer to map input data to output data. There are a few instances where this isn’t the case but they’re in the minority and it’s generally helpful to think of ML this way.
There are two really good machine learning packages for Python, let’s talk about them both.
Scikit-Learn
Most of the time you spend doing machine learning in Python will be spent using the Scikit-Learn package (sometimes abbreviated sklearn).
This package implements a whole heap of machine learning algorithms and exposes them all through a consistent syntax. This makes it really easy for data scientists to take full advantage of every algorithm.
The general framework for using Scikit-Learn goes something like this –
You split your dataset into train and test datasets:
Then you instantiate and train a model:
And then you use the metrics module to test how well your model works:
XGBoost
The second package that is commonly used for machine learning in Python is XGBoost.
Where Scikit-Learn implements a whole range of algorithms XGBoost only implements a single one — gradient boosted decision trees.
This package (and algorithm) has become very popular recently due to its success at Kaggle competitions (online data science competitions that anyone can participate in).
Training the model works in much the same way as a Scikit-Learn algorithm.
Deep Learning in Python
The machine learning algorithms available in Scikit-Learn are sufficient for nearly any problem. That being said, sometimes you need to use the most advanced thing available.
Deep neural networks have skyrocketed in popularity due to the fact that systems using them have outperformed nearly every other class of algorithm.
There’s a problem though — it’s very hard to say what a neural net is doing and why it’s making the decisions that it is. Because of this, their use in finance, medicine, the law and related professions isn’t widely endorsed.
The two major classes of neural network are convolutional neural networks (which are used to classify images and complete a host of other tasks in computer vision) and recurrent neural nets (which are used to understand and generate text).
Exploring how neural nets work is outside the scope of this article, but just know that the packages you’ll need to look for if you want to do this kind of work are TensorFlow (a Google contibution!) and Keras.
Keras is essentially a wrapper for TensorFlow that makes it easier to work with.
Data Science APIs in Python
Once you’ve trained a model, you’d like to be able to access predictions from it in other software. The way you do this is by creating an API.
An API allows your model to receive data one row at a time from an external source and return a prediction.
Because Python is a general purpose programming language that can also be used to create web services, it’s easy to use Python to serve your model via API.
If you need to build an API you should look into the pickle and Flask. Pickle allows you to save trained models on your hard-drive so that you can use them later. And Flask is the simplest way to create web services.
Web Applications in Python
Finally, if you’d like to build a full-featured web application around your data science project, you should use the Django framework.
Django is immensely popular in the web development community and was used to build the first version of Instagram and Pinterest (among many others).
Summary
And with that we’ve concluded our whirlwind tour of data science with Python.
We’ve covered everything you’d need to learn to become a full-fledged data scientist. If it still seems intimidating, you should know that nobody knows all of this stuff and that even the best of us still Google the basics from time to time.
Se você tiver Microsoft 365 Apps para Grandes Empresas (dispositivo) ou Microsoft 365 Apps for Education (dispositivo), poderá atribuir licenças ...
Confira todo o nosso conteúdo para pequenas empresas em Ajuda para pequenas empresas & aprendizado.
Confira a ajuda para pequenas ...
A Microsoft lançou as seguintes atualizações de segurança e não segurança para o Office em dezembro de 2023. Essas atualizações ...
